
When we talk about measuring student engagement, we're really talking about looking past the obvious. It’s not just about whether a student shows up to class. We need to dig deeper to see how invested they truly are in their own learning by tracking their behavior, their cognitive efforts, and even their emotional connection to the material.
This means we're assessing things like active participation, intellectual curiosity, and a genuine sense of belonging. It's the only way to get a real feel for how much they're comprehending and connecting with their education.
Why Student Engagement Is Your Most Important Metric
Let’s be real for a moment. "Engagement" gets thrown around a lot, but it’s far more than just a buzzword. It’s the very foundation of effective learning. In today's educational environment, being able to accurately measure it is non-negotiable. It gives you a direct window into how well your teaching methods are landing and the overall health of your learning community. When students are genuinely engaged, the positive effects are impossible to miss. They aren't just checking boxes and completing assignments; they're connecting with the subject matter on a much deeper level. This kind of active involvement is consistently linked to better academic outcomes, from higher grades all the way to graduating on time.
Connecting Engagement to Critical Outcomes
The link between active student participation and crucial success metrics is crystal clear. Students who are highly engaged are far more likely to push through difficult challenges, sharpen their critical thinking skills, and build a stronger community with classmates and instructors. This isn't just about making them feel good—it's about equipping them with the resilience and skills they need for life after graduation. Just think about some of the core benefits:
- Deeper Comprehension: Engaged students aren't just memorizing facts for a test. They're actually understanding and applying complex concepts.
- Higher Retention Rates: When a student feels a sense of belonging and is intellectually invested, they are much more likely to stick with their program and see it through to completion.
- Improved Workforce Readiness: The soft skills honed through active learning—like creative problem-solving and effective collaboration—are precisely what today's employers are looking for.
Reshaping Institutional Strategy with Data
Insights pulled from engagement data are changing how institutions approach everything, from curriculum design to long-term strategic planning. Measuring student engagement has become essential because of its direct line to student satisfaction, better educational outcomes, and post-graduation success. A 2025 Deloitte report points out that institutions focusing on engagement foster a greater sense of commitment from students, which is key to rebuilding public trust. For instance, universities like Arizona State and Ohio State have seen tangible increases in engagement by integrating students into on-campus workforce development programs. You can explore more about these trends and how they're shaping higher education.
By tracking engagement, institutions can demonstrate undeniable value to students and their families. This isn't about surveillance; it's about accountability and a commitment to continuous improvement.
Ultimately, keeping a close eye on these metrics allows educators and administrators to stop making assumptions and start making informed decisions. It shifts the entire conversation from, "Are students paying attention?" to a more powerful question: "Are we creating an environment where every single student has the opportunity to thrive?" The answers hidden in that engagement data are what build trust and pave the way for real, lasting success.
Defining What Engagement Looks Like in Your Classroom
You can't fix what you don't measure. When we talk about "student engagement," it can feel a bit fuzzy and abstract. But in reality, it's made up of concrete actions and attitudes you can actually see and track in your classroom. The best way I've found to get a handle on it is to break engagement down into three core types: behavioral, emotional, and cognitive. Thinking in these categories gives you a solid framework and moves you beyond just tracking who shows up for class. It helps you build a complete picture of how students are really doing.
The Three Dimensions of Student Engagement
Each of these dimensions gives you a different window into your students' world.
Behavioral engagement is the most obvious one. It’s what you can see. Are students logging into the LMS? Are they turning in their assignments? How often do they speak up in class or post on the discussion board? These are all observable actions.
Emotional engagement, on the other hand, gets at how students feel about the class. Do they feel connected to their peers and to you? Are they motivated, or do they seem stressed and anxious? You can get clues from poll responses, the tone of their comments, or even just noticing who is willing to ask for help.
Finally, there’s cognitive engagement. This is the deep stuff—the mental heavy lifting. It’s about how much effort students are putting into grappling with complex ideas. You see this in the thoughtful questions they ask, the quality of their project submissions, and their ability to connect what they're learning to new problems.
A classic mistake is to get hyper-focused on behavioral metrics just because they're easy to quantify. The real magic happens when you start connecting data from all three dimensions to understand the why behind what students are doing.
This holistic approach is becoming absolutely essential. As the global education market speeds toward an estimated $10 trillion by 2030, there's a huge push to get smarter about how we measure what works. Things like attention spans, participation rates, and feedback scores are no longer just "nice-to-haves"—they're becoming central to how we evaluate our own teaching. You can dive deeper into these trends in HolonIQ's 2025 Global Education Outlook.
This chart gives a great visual of how these different metrics can tell a more nuanced story.
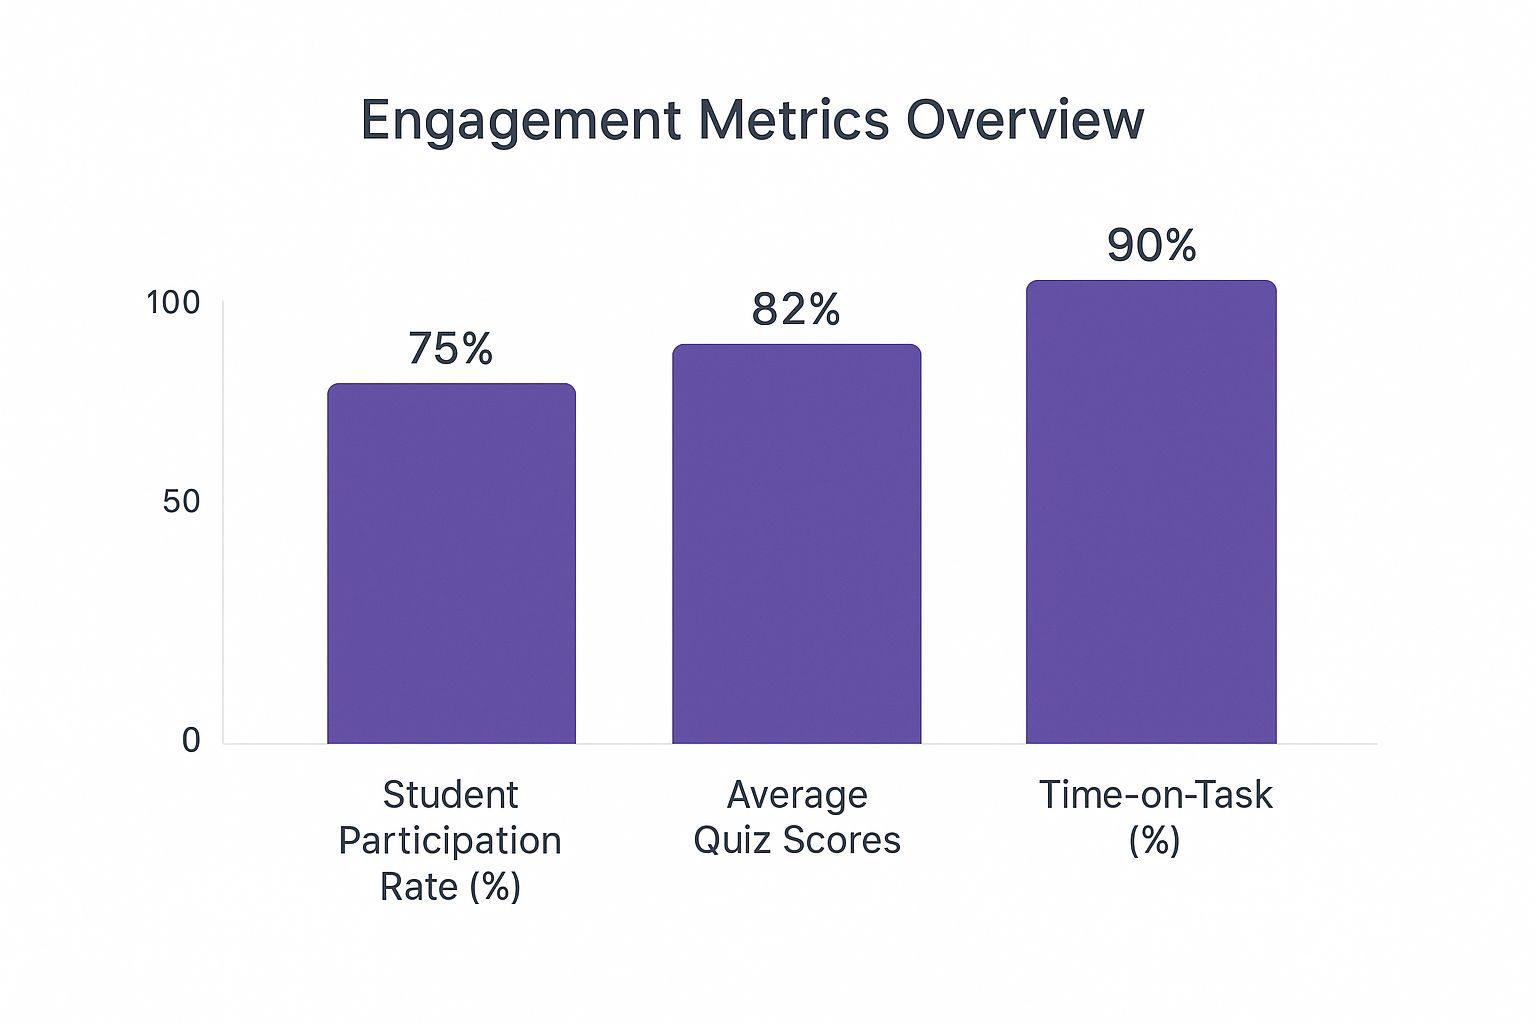
You can see that even with high participation, the actual time spent on tasks might be lagging. That's a perfect example of why you need more than one data point to understand what's truly going on.
Choosing Metrics That Matter for You
So, which metrics should you track? Honestly, it depends entirely on your teaching environment. The data that's most valuable for a small, in-person seminar is going to look very different from the data you’d pull for a massive online course. To make this more concrete, here's a quick guide to help you pick the right metrics for your specific classroom setup.
Choosing Engagement Metrics for Your Learning Environment
| Engagement Type | In-Person Classroom Metric | Online Classroom Metric | Hybrid Model Metric |
|---|---|---|---|
| Behavioral | Verbal participation, attendance, use of office hours | Login frequency, completion of optional modules, video view duration | Combination of in-class participation and LMS activity logs |
| Emotional | Body language, "fist-to-five" confidence polls, direct feedback | Sentiment analysis of forum posts, survey responses, one-on-one check-in notes | Exit tickets (digital or physical), poll responses from both cohorts |
| Cognitive | Depth of questions asked, performance on in-class problem-solving | Quality of discussion posts, collaborative document contributions | Performance on a complex project that blends online research and in-class presentation |
The goal here isn't to get bogged down in a sea of data. It's about being intentional. By first defining what meaningful engagement looks like in your course, you can choose a few key indicators that will give you actionable insights. And if you’re looking for a great starting point on how to boost these numbers, our guide on practical student engagement strategies is packed with ideas you can implement right away.
Finding the Right Tools for Gathering Data
Once you've nailed down the engagement metrics that matter most to you, the next puzzle piece is figuring out how to actually collect that data. The market is flooded with tools, and it's easy to get overwhelmed. But the goal isn’t to build a complicated, expensive system. It’s to create a practical “tech stack” that gives you real insights without burying you in administrative work.
You might be surprised to learn that some of the most powerful tools are likely already at your disposal.
Your school’s Learning Management System (LMS) is the obvious starting point. Platforms like Canvas, Blackboard, or Moodle are goldmines of behavioral data, and they track much of it automatically. You don't have to do a thing.
Right out of the box, your LMS can probably tell you:
- How often students are logging in (login frequency) and for how long.
- Which course materials—videos, articles, external links—are getting the most clicks.
- Assignment submission rates and if students are turning work in on time.
- Who is participating in discussion forums and who is staying silent.
This data alone gives you a solid foundation for understanding how your students are interacting with the basic mechanics of your course.
Expanding Your Toolkit Beyond the LMS
Your LMS is the workhorse for behavioral data, but you'll need a few other tools in your belt to get a read on emotional and cognitive engagement. The good news is that many of these are free or very low-cost, making them easy to fold into your routine. Simple tools like Google Forms or Microsoft Forms are fantastic for creating quick "pulse check" surveys or anonymous exit tickets. These are perfect for tapping into emotional data. For instance, you could ask students how they're feeling about a tricky new concept or how confident they are heading into an exam. A quick, two-question survey at the end of a module can give you an immediate and incredibly valuable snapshot of the classroom vibe.
Remember, the best tools are the ones you'll actually use consistently. A simple, well-designed survey you send out every Friday is far more valuable than a complex analytics platform you only have time to check once a semester.
When you're picking out new tools, it helps to put on an analyst's hat. The fundamental principles of good data collection are the same everywhere, from the classroom to the boardroom. In fact, looking at established marketing campaign tracking strategies can provide some surprisingly useful frameworks for organizing your own efforts.
Specialized Platforms and AI
If your institution is ready to make a bigger investment in tracking student engagement, there are specialized platforms that offer much deeper capabilities. These tools often use AI to pull out subtle insights, like running sentiment analysis on discussion board posts to gauge the overall emotional tone of the conversation. Some can even generate a unique “engagement score” for each student by pulling in data from multiple sources. Before you jump into one of these more advanced solutions, it’s wise to ask a few key questions:
- Budget: Is the price tag something your department or institution can realistically sustain?
- Time: What’s the learning curve? How much of your time will be spent managing the platform itself?
- Integration: Will it play nicely with your LMS and the other systems you already rely on?
Ultimately, your ideal toolkit is a thoughtful blend. It should start with the rich data you already have in your LMS, be supplemented by simple tools for quick feedback, and only include advanced platforms when they solve a specific problem your current setup can't handle.
Making Sense of Your Engagement Data

Collecting student engagement data is often the easy part. Your Learning Management System can spit out a mountain of numbers, but the real art is turning that raw information into a meaningful story. The data itself won't tell you why a student is suddenly struggling or what’s causing them to thrive. That’s where your expertise and intuition as an educator come into play.
Your job is to become a trend-spotter—a detective looking for clues hidden in the data. A single dip in forum activity might be nothing, just a busy week. But what if that dip lines up with low quiz scores and missed deadlines for the same group of students? Now you've found a pattern, a clear signal that something needs a closer look.
This analytical mindset is more crucial than ever. A 2025 study on global online learning found that nearly half (49%) of all students have taken an online course. This shift has pushed us to find new ways to measure engagement, moving beyond simple logins to track things like time spent on specific tasks or the quality of virtual discussions. The numbers tell the story: between 2019 and 2020, the count of students in exclusively online programs skyrocketed from 2.4 million to 7 million.
Connecting Data Points to Build a Complete Picture
The most powerful insights don't come from a single metric. They emerge when you start layering different types of data on top of one another. Just looking at behavioral metrics—like how often a student logs in—only tells you who is showing up. To really get what's going on, you need to pull in cognitive and emotional data, too. Let's walk through a real-world scenario I've seen play out:
- Behavioral Data: You notice a student, let's call her Alex, hasn't posted in the discussion forums for two straight weeks.
- Cognitive Data: You check her grades and see her assignment scores have dropped from a solid A to a C in that same timeframe.
- Emotional Data: You send out a quick, anonymous class poll and discover that 30% of students feel "overwhelmed" by the current module.
Suddenly, the picture becomes much clearer. You've moved from a simple observation ("Alex isn't participating") to a strong hypothesis ("Alex, and maybe others, are struggling with this topic and feel too overwhelmed to even ask for help"). This is the kind of analysis that truly makes a difference.
Data doesn't give you answers; it just helps you ask much better questions. The numbers point to what is happening. It's our job to dig into the why and decide how to respond.
From Individual Metrics to Cohort-Level Insights
While keeping an eye on individual students is essential, spotting trends across the entire class can make your efforts far more efficient and impactful.
For example, do you see that a huge chunk of the class isn't watching a specific lecture video all the way through? That might not be a student motivation problem. It could be a sign that the video itself is the issue—maybe it's too long, the audio is poor, or the content is confusing. Fixing that one video could improve the learning experience for everyone.
By looking for these larger patterns, you can make proactive tweaks to your course design and teaching methods. This big-picture thinking is a core part of any strong approach to higher education data analytics.
Ultimately, making sense of your data means moving beyond the spreadsheet. It's about blending the quantitative numbers with your qualitative, human understanding of your students to create an environment where everyone has a better shot at success.
Turning Your Data Into Better Teaching
Collecting all this engagement data is a great start, but it's what you do with it that really counts. The whole point is to move beyond numbers on a dashboard and use those insights to make real, practical changes in your classroom. This is where the magic happens. It’s all about closing the loop—turning what you observe into tangible action. You’re essentially becoming a detective, looking for clues in the data that tell you how to best support your students, whether that means a small tweak to an assignment or a complete overhaul of a lesson plan.
From Data Points to Classroom Action
When you spot a pattern in your data, that’s your cue to act. The trick is to connect what you’re seeing with specific, evidence-based teaching tactics. Avoid generic "engagement boosters" and instead, tailor your response to the exact problem the data has uncovered. If you want to dive deeper into this process, there are fantastic resources that show you how to Turn Data Into Actionable Insights. Let’s look at a few real-world scenarios I’ve seen play out:
- The Finding: You notice in your LMS analytics that almost no one is re-watching a key lecture video, and the quiz scores for that topic are dismal.
- The Action: Instead of just sending a reminder to re-watch it, you could break it down. Maybe create a quick, two-minute summary video highlighting the must-know concepts. Or, you could develop a guided notes worksheet that helps students actively process the information as they watch the original lecture.
- The Finding: Sentiment analysis from your discussion forums shows a lot of neutral or even negative language. Students just don't seem emotionally invested.
- The Action: Try a "Think-Pair-Share" activity. It gives students a low-stakes way to organize their thoughts with a single partner before presenting to the whole class. This can be a huge confidence-builder and helps foster a stronger sense of community.
Responding to Different Engagement Gaps
The way you intervene should be just as nuanced as the data you're collecting. A slump in behavioral engagement calls for a different solution than a drop in cognitive engagement.
For Low Cognitive Engagement
What if your data suggests students are just going through the motions? They're turning in assignments, but they aren't thinking deeply. Superficial discussion posts and low scores on open-ended questions are dead giveaways.
Pro Tip: Try shifting from assignments based on recall to projects that demand inquiry. Instead of having students summarize a historical event, challenge them to analyze primary source documents and build their own argument about what happened. This pushes them up Bloom's Taxonomy, moving beyond "Remembering" and into "Analyzing" and "Creating."
For Low Emotional or Behavioral Engagement
When students seem checked out or participation is down, it’s time to focus on rebuilding that sense of community and making the material feel relevant. This might show up as low attendance, empty office hours, or minimal interaction on group projects.
One of the most effective things you can do here is connect the material to their lives. For instance, in a statistics class, let students find and analyze a dataset related to their major, a hobby, or a career they're interested in. This simple shift can make a world of difference in their personal investment. These kinds of strategies are at the heart of many successful student success initiatives designed to pull learners back in.
At the end of the day, using data to improve your teaching is a cycle. You spot a trend, try a targeted fix, and then keep measuring to see if your change actually worked. It's this ongoing commitment to data-informed improvement that really builds a dynamic and supportive learning environment for everyone.
Common Questions About Measuring Student Engagement
As educators, we're naturally curious and analytical. So, when we start talking about measuring student engagement, it’s no surprise that some tough questions come up. Let's tackle these head-on, because working through them is the key to creating a plan that feels both effective and ethical. The whole point is to use data to support our students, not to make them feel like they're under a microscope. When you’re transparent and communicate clearly, you can build trust while still getting the insights you need to improve the learning experience.
How Can I Measure Engagement Without Spying on Students?
This is easily the most common—and most important—question I hear. The answer really boils down to transparency and purpose. You have to frame your efforts as a way to improve the course for everyone, not as a way to police individuals. When you explain that you're trying to figure out which resources are most helpful or where the class as a whole gets stuck, it stops feeling like surveillance and starts feeling like a team effort. Focus on the aggregate data from your LMS and anonymous surveys instead of invasive, individual click-tracking. This shifts the dynamic from policing to partnership.
Is There One Single Metric That Is Most Important?
Not a chance. A single metric can never tell the whole story. In fact, relying on just one number, like how often a student logs in, can be incredibly misleading. The real magic happens when you start layering different data points to get a complete picture.
Think of it like building a "student engagement profile" for your class. This profile should pull from behavioral data (like assignment submission rates), cognitive data (like the quality of discussion posts), and even emotional data (from quick polls or anonymous surveys). This balanced approach is far more accurate and gives you a real foundation for taking action.
I've seen it time and again: a student might not log in frequently but will submit incredibly thoughtful, high-quality work. If you only looked at their login stats, you'd completely misjudge their level of engagement.
How Often Should I Analyze Engagement Data?
The key here is to find a rhythm you can actually stick with. If you try to analyze everything daily, you'll just burn out. It's not sustainable.
For a standard semester-long course, I’ve found a great cadence is a light weekly check-in paired with a more thorough deep dive every three or four weeks.
Here’s what that could look like in practice:
- Weekly Check-In: Just five minutes to scan the key metrics. Are the discussion forums active? Are there any glaring red flags with assignment submissions? This is just about catching big problems early.
- Deeper Dive (Monthly): Block out an hour to really dig into the trends. How does the data from the first month compare to the second? Are you seeing any patterns across the whole class that you need to address in your teaching?
This approach helps you stay responsive without getting lost in the minor, day-to-day ups and downs of the data.
Can These Methods Work in a Very Large Class?
Absolutely, but you have to adjust your strategy and lean more heavily on technology. When you're teaching a lecture course with hundreds of students, tracking individuals is just not practical. The focus has to shift from one-on-one intervention to identifying broader, cohort-level patterns.
Technology becomes your best friend in this scenario. Use your LMS analytics to spot trends in which content is being accessed most or where students are struggling on assessments. During lectures, live polling tools are fantastic for getting a real-time pulse on whether a concept is landing. You can even use automated sentiment analysis on the forums to gauge the overall mood without having to read every single post.
In a large class, the goal is to make smart, efficient adjustments that benefit the entire group.
At Motimatic, we know that identifying at-risk students and acting on engagement data is a huge challenge. Our platform uses behavioral science and AI to deliver personalized, motivational messaging that guides students to success, all without adding to your workload. Learn how you can improve retention and enrollment.
See it on your own listOne list, one goal, and a randomized holdout to show the lift. Start a pilot