When we talk about student success, it's easy to think of it in terms of final grades and graduation rates. But those are just the final score. Student success indicators are the vital signs we check throughout the entire game—the ongoing measurements that tell us how a student is really doing on their educational journey.
Think of it like this: a final report card is a snapshot in time, an outcome. But the real indicators are more like a car's dashboard, giving you constant, real-time feedback. They signal everything from academic momentum to campus connection and even personal well-being, allowing you to offer a hand before a student starts to struggle.
What Are Student Success Indicators, Really?
Graduation rates and GPAs are important, of course. The problem is they are lagging indicators—they tell you what’s already happened. By the time a student’s GPA drops, the problem has already taken root.
True, modern student success metrics give you a much more complete, forward-looking view. They're a collection of diverse data points that, when you put them all together, paint a rich, detailed picture of a student’s progress, their challenges, and their overall experience. Relying only on graduation rates is like trying to understand a marathon just by looking at the finish-line photo. You miss the whole story.
To truly support students, we have to look at the entire race, not just the finish line.
Beyond Grades To A Holistic View
Effective support means tracking a mix of metrics that reflect a student’s whole experience. We need to focus on leading indicators—the early clues that can signal future outcomes and give us a chance to step in proactively. These indicators usually fall into a few key areas:
- Academic Performance: This is so much more than just grades. It includes things like the rate at which students are earning credits and whether they're successfully passing those critical first-year courses. These are often powerful predictors of whether a student will stay enrolled.
- Student Engagement: How connected is a student to the campus community? We can get a feel for this by looking at their activity in the Learning Management System (LMS), their attendance at campus events, or how often they use resources like the library or tutoring centers.
- Support Services Utilization: Are students actually using the help you're offering? Tracking how often they connect with academic advising, career services, or wellness centers tells you if your resources are hitting the mark.
The big idea here is to move from a reactive model—waiting for a student to fail or drop out—to a proactive one. By keeping an eye on these varied indicators, you can spot students who might be at risk much earlier and offer the specific, timely support that can make all the difference.
The Four Pillars of Student Success
To get a truly comprehensive picture, it's helpful to think about student success as being built on four distinct but interconnected pillars. Each one provides a different lens through which to view a student's journey.
| Pillar of Success | What It Measures | Example Indicators |
|---|---|---|
| Academic | Progress toward degree and foundational learning. | GPA, credit completion rate, course pass rates, time-to-degree. |
| Engagement | Connection to the institution and learning community. | LMS activity, event attendance, club participation, library usage. |
| Financial | The ability to afford and manage the cost of education. | FAFSA completion, unmet financial need, on-campus employment. |
| Well-being | Personal, social, and emotional health. | Use of counseling services, housing stability, sense of belonging surveys. |
Looking at success through these four pillars ensures you aren't missing critical pieces of the puzzle. A student could have a 4.0 GPA but be struggling with financial stress or a low sense of belonging, putting them at risk despite their academic strength.
The infographic below helps visualize how these different factors come together to form a complete framework for understanding and supporting student progress.
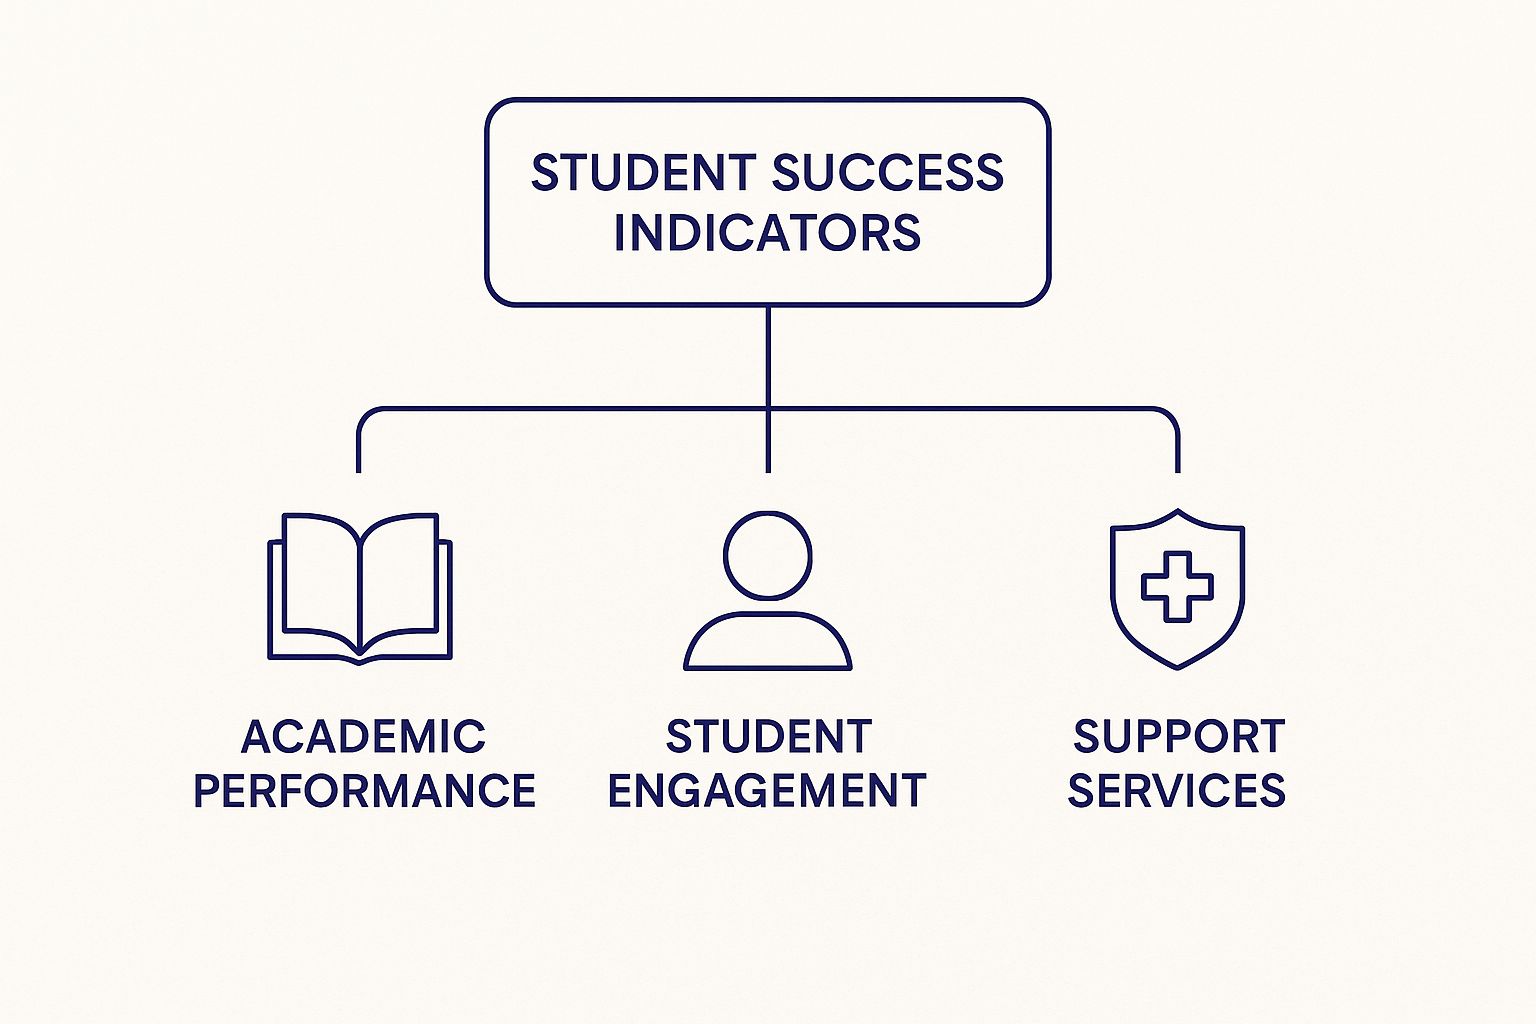
As you can see, a student's path is shaped by a blend of academic, engagement, and support-related factors. Every modern institution that wants to effectively guide students from their first day on campus to graduation day and beyond needs to embrace this multifaceted view.
How We Measure Student Success Is Changing

For a long time, the scorecard for higher education was pretty straightforward. It mostly came down to two things: how many students enrolled and how many eventually graduated. But just counting heads and diplomas isn't cutting it anymore.
Today, there's a growing chorus of voices—from students and their families to employers and accrediting bodies—demanding more. They want to see real, tangible proof of value. The conversation is shifting away from a simple final count and toward a more active, ongoing story of student support.
The new question isn't just, "Did they finish?" It's, "How well did we guide each student toward finishing on time and preparing them for what comes next?" This change means we have to get much smarter about tracking student success indicators. Data isn't just a nice-to-have; it's an absolute must.
The New Era of Accountability
A huge part of this push comes from the organizations that give colleges their seal of approval: the accrediting bodies. They’re no longer satisfied with a simple report card. They’re asking institutions to track success metrics with a fine-toothed comb, show that they're consistently getting better, and see how they stack up against similar schools.
This creates a powerful reason for colleges and universities to really dig into their own data.
But this new level of accountability is about much more than just checking boxes for compliance. It’s about creating a transparent system that helps everyone involved. When schools are held to a higher standard, they're driven to innovate and make the entire student experience better from the inside out.
Take the Higher Learning Commission (HLC), a major accreditor, for example. They are rolling out revised criteria, set to take effect by September 2025, that will require institutions to prove they are making steady gains in key student success indicators. We're not just talking about graduation anymore, but also things like year-over-year persistence and completing degrees in a reasonable timeframe.
Beyond Compliance To Continuous Improvement
This pressure from the outside is pushing institutions to think differently. Instead of just using data to look back and write reports, forward-thinking schools are using it to make smarter decisions every single day.
The real goal here is to create a living feedback loop. You take the insights from student data and use them to build better programs, offer more effective support, and create a campus that truly responds to student needs. Accountability stops being a chore and starts becoming a catalyst for real growth.
This approach directly benefits students by creating an environment where their journey is actively monitored and supported. The focus is now on metrics that tell a much richer story, including:
- Persistence Rates: What percentage of students come back for another year? This is a powerful signal of student satisfaction and whether they feel connected to the institution.
- Timely Completion: How many students are finishing their degrees within 150% of the standard time (like completing a four-year degree within six years)?
- Benchmarking Performance: How do our outcomes compare to schools like ours? This helps pinpoint where we're excelling and where we have room to improve.
Ultimately, this evolving landscape is forcing a much-needed conversation about what it means to truly serve students. It’s about building a system that is honest, transparent, and completely focused on setting every single student up for success.
Key Academic and Engagement Metrics You Should Be Tracking
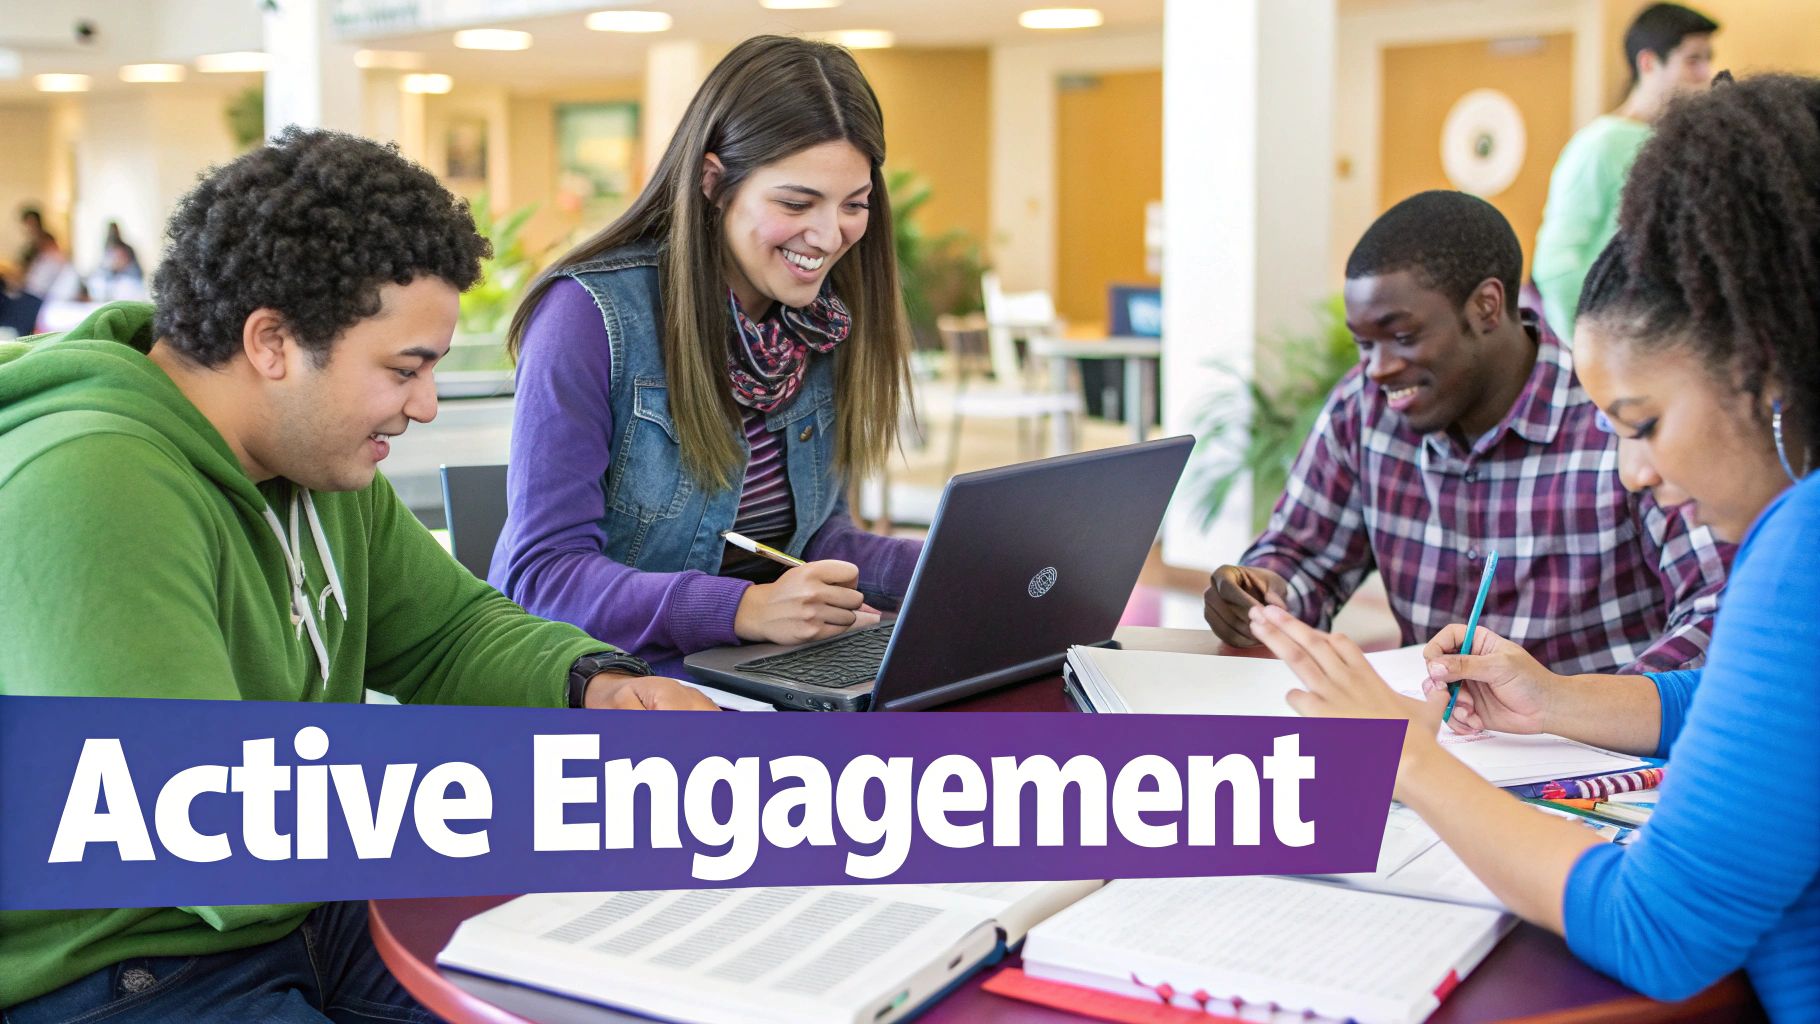
To truly understand the student journey, you need the right data. It's easy to focus on lagging indicators like graduation rates—they're the final destination, after all. But the real magic lies in the leading indicators. These are the road signs telling you whether a student is on the right path or veering off course.
By tracking a healthy mix of both academic and engagement metrics, you get the full story. When you analyze these data points together, you can see a student's entire trajectory. This empowers your team to offer targeted support long before a student even realizes they need help, shifting your approach from reactive problem-solving to proactive guidance.
Academic Indicators: Looking Beyond the GPA
The GPA is a classic, but let's be honest: by the time a GPA drops significantly, you're already behind. To get ahead of potential trouble, you need to focus on more dynamic academic student success indicators.
- Credit Accumulation Rate: This is all about momentum. Is a student earning credits at a pace that will get them to graduation on time? Even someone with a solid GPA who is falling behind on credits is a major retention risk.
- Progress in Gateway Courses: Those first-year "make-or-break" courses in foundational subjects like math and English are critical. Tracking pass rates here gives you an early warning if a student is struggling with the core skills needed to succeed.
- Major-Specific Course Performance: How is a student doing in the classes that actually matter for their chosen career path? If an aspiring engineer is struggling in their core engineering classes, it might signal a need for specialized tutoring or even a conversation about whether it's the right major for them.
These academic metrics tell you the "what"—the hard evidence of a student's progress. But to understand the "why" behind those numbers, you have to look at how engaged they are.
Engagement Metrics: The Pulse of the Student Experience
Engagement metrics reveal a student's connection to the campus community and, just as importantly, to their own education. Low engagement is often one of the earliest and quietest signs of distress or disinterest.
Think of engagement data as the pulse of the student experience. A strong, steady pulse suggests a student feels they belong and are invested in their education. A weak or erratic one is a call for immediate attention.
On a global scale, standardized tests also offer a window into engagement and performance. The Programme for International Student Assessment (PISA), for example, has tested 15-year-olds in 81 countries since 2000, giving us a massive dataset to compare educational systems. A recent assessment showed U.S. 5th graders ranking high in reading literacy, illustrating how these large-scale student success indicators can help put national achievements into a global context.
Key Engagement Data to Monitor
So, how do you measure that pulse on your campus? By turning to data from various student touchpoints. Using higher education data analytics, you can weave these disparate signals into a coherent picture of each student's involvement. Here are some of the most telling engagement metrics to watch:
- Learning Management System (LMS) Activity: How often are students logging in? Are they actually participating in online discussions, or are they just downloading the slides five minutes before an exam? A sudden drop in LMS usage is a classic red flag.
- Campus Event Attendance: Tracking who shows up for everything from career fairs to football games tells you who is building a community on campus and who might be feeling isolated.
- Library and Tutoring Center Usage: The students who proactively use academic support services are often the ones most committed to their own success. Monitoring this usage helps you identify not only those who need help but also those who are actively seeking it.
Using Technology For Proactive Student Support
Collecting data on student success indicators is one thing, but it’s what you do with that data that truly matters. The real magic happens when you use those insights to make a tangible difference in a student's life. Instead of waiting for a student to wave a white flag, innovative institutions are getting ahead of the curve, using technology to anticipate needs and offer help before it's even requested. Think about it: what if you could spot a student who is silently struggling long before their GPA takes a hit? That's precisely what predictive analytics and AI are making possible in higher education today. By analyzing subtle patterns across academic and engagement data, these systems can flag students who are starting to drift. This gives advisors a chance to step in with the right guidance at the perfect moment, shifting the entire support model from reactive to proactive.
From Raw Data to Real Support
The ultimate goal here is to transform numbers on a spreadsheet into timely, meaningful, and sometimes life-changing conversations. Technology is the bridge that gets you there, turning raw data into clear, actionable insights for your faculty and staff. For example, a student success platform might notice a first-year student’s activity in the Learning Management System (LMS) has suddenly dropped by 50% in just two weeks. At the same time, it sees they haven't swiped their ID at any campus events. This combination of student success indicators isn't just a blip on a chart; it’s a story unfolding.
The system doesn't just send a generic alert saying, "This student is at risk." It provides the why: "This student is disengaging from both their coursework and the campus community." This context allows an advisor to start a much more informed and empathetic conversation, asking what’s really going on—whether it's academic pressure, social isolation, or something else entirely.
This data-informed approach allows for truly personalized advising at a scale that would be impossible to manage by hand. It ensures support isn't just available—it's actively delivered to the students who need it most, exactly when they need it.
The Future of Student Success Is Proactive
This shift toward data-informed support isn't just a passing trend; it's a fundamental change in how we think about education. In fact, by 2025, it's expected that student success will lean even more heavily on using data and technology to tackle persistent challenges like learning gaps and equity issues. The old-school, time-based model of education is giving way to competency-based approaches that care more about what students can do than how long they’ve sat in a classroom. When institutions embrace these tools, they build a more powerful and equitable support system for everyone. The result is a campus where technology works quietly in the background, creating a safety net that helps every student find their path to the finish line.
Building A Campus-Wide Culture Of Student Success
Tracking student success indicators is a fantastic start, but the data itself is just a bunch of numbers in a spreadsheet. It doesn't magically create change. Real, lasting transformation happens when that information gets out of the hands of just one office and becomes a shared mission for the entire campus.
Frankly, student success can't just be the "job" of the advising department. It has to be woven into the very fabric of the institution.
Think of it like an orchestra. If the advising team is playing a beautiful violin solo, but the faculty are playing a completely different tune on the trumpets, and the financial aid office is banging on the drums with no rhythm, you don't get music. You get chaos. A true culture of success means everyone is working from the same sheet music, all focused on one thing: helping every single student thrive.
Breaking Down Departmental Silos
One of the biggest hurdles to getting everyone on the same page is the invisible walls that spring up between departments. Admissions, student affairs, academic advising, and financial aid often work in their own little worlds. They all collect incredibly valuable information, but that information rarely leaves their office. The result? A confusing and disconnected experience for the student.
The first, and most critical, step is to start knocking down those walls. This isn't just about sharing data; it's about creating clear pathways for information to flow between teams in a way that makes sense.
Imagine an academic advisor seeing a flag for poor attendance. If they can also see a note from the financial aid office that the student's verification paperwork is overdue, the conversation changes completely. They can now offer support that gets to the root of the problem, not just the symptom. This shared understanding is the bedrock of a proactive support system.
When departments are siloed, students are forced to navigate a maze of disconnected offices, repeating their story over and over again. A unified culture creates a seamless support system where the institution anticipates a student's needs and works together behind the scenes to help them succeed.
Forging Cross-Functional Teams
To make this kind of collaboration happen, you have to be intentional about it. That means building cross-functional teams dedicated to student success. These teams should bring together people from all the key areas of campus life.
- Faculty Members: They offer firsthand insight into what's happening in the classroom and where students might be struggling with the curriculum.
- Academic Advisors: They are on the front lines, guiding students day-to-day and monitoring their academic journey.
- Financial Aid Officers: They have a deep understanding of the economic pressures that can derail even the most motivated student.
- Student Affairs Professionals: They manage everything from campus life and student clubs to mental health and wellness.
When you bring these different perspectives to the same table, you can develop comprehensive student success initiatives that see the student as a whole person, not just a grade or an ID number. With shared goals and clear ways to communicate, the entire campus begins to work in harmony. You start guiding students from their very first day all the way to graduation. That coordinated, all-hands-on-deck effort is the true sign of a culture of success.
Your Action Plan for Implementing Success Indicators

Turning powerful insights into real-world impact starts with a clear, practical roadmap. The idea of building a system around student success indicators can feel daunting, but it doesn't have to be. It’s really about taking methodical, common-sense steps to create a framework that fits your institution's unique culture and resources.
Think of the following steps as a flexible blueprint, not a rigid set of rules. You can adapt it to launch a brand-new program or simply fine-tune what you're already doing. The ultimate goal is to build a sustainable cycle of learning from data and taking meaningful action.
Define Your Vision and Key Metrics
Before you can measure anything, you have to define what success actually looks like for your students, on your campus. What outcomes truly matter most? Is your top priority improving first-year persistence rates? Maybe it's about closing stubborn equity gaps or boosting on-time graduation. Get specific. Once your vision is clear, pinpoint the most powerful indicators you can realistically track with the resources you have now. Don't overcomplicate it. Start with accessible data points that give you the biggest bang for your buck, like:
- Credit accumulation rates to see if students are maintaining academic momentum.
- LMS login frequency as a proxy for digital engagement and connection to coursework.
- Advising appointment attendance to understand who is (and isn't) seeking help.
The key is to avoid trying to track everything at once. Pick a handful of high-impact metrics that tell a clear story about the student journey at your institution.
The most effective strategies start with a focused definition of success. Instead of boiling the ocean, identify 3-5 core student success indicators that directly align with your institution's primary goals for retention and completion.
Implement and Train for Action
With your core metrics chosen, the next phase is all about technology and people. You'll need the right tools to gather, analyze, and make sense of this data. This could mean getting more out of your existing student information system or bringing in a dedicated student success platform designed for this purpose.
But remember, even the most sophisticated technology is useless if your team doesn't know what to do with it. Your advisors, faculty, and support staff are the ones on the front lines. They need to be trained not just on how to read a dashboard, but on how to turn those data points into effective, empathetic student interventions.
Finally, build a feedback loop to keep improving. Regularly ask what's working, what's falling flat, and how you can refine your approach. This iterative process ensures your student success initiatives stay relevant and responsive to the ever-changing needs of your students.
Frequently Asked Questions About Student Success
When you’re dedicated to improving student outcomes, it's natural to have questions. Let's tackle some of the most common ones that come up for higher-ed professionals trying to make sense of student success data.
What Is The Difference Between Leading And Lagging Indicators?
It helps to think about this in terms of personal health. A lagging indicator is the result you get at the end of a check-up, like a diagnosis or your final cholesterol numbers. In higher education, this translates to things like graduation rates or a student's final GPA—important, but they only tell you what has already happened. Leading indicators are more like your daily vitals—your blood pressure, heart rate, or how many steps you took. They are the early student success indicators that offer a real-time pulse on a student's journey. Things like consistent LMS logins or showing up for advising appointments are leading indicators that give you a chance to step in before a small issue becomes a major roadblock.
How Many Student Success Indicators Should We Track?
There isn't a single magic number here. The key is to prioritize quality over quantity. A great starting point for most institutions is to identify 3-5 core indicators that tie directly to your most pressing strategic goals. For instance, if your main focus is improving first-year retention, you could start by tracking:
- Pass rates in gateway courses
- How many credits a student successfully earns each term
- Their level of engagement with the LMS
The aim is to find metrics that give you genuinely actionable insights, not just to drown your team in more data.
The goal isn't to collect every piece of data possible. It's to find the vital signs that most accurately predict a student's trajectory and empower your team to provide meaningful support.
Truly effective strategies for retention and institutional engagement are built on a handful of these carefully chosen predictive metrics. When you start small and stay focused, your team can gain confidence and start seeing real results much faster.
Ready to turn insights into action? Motimatic helps institutions proactively support students by delivering personalized, science-backed motivation at scale. Guide every student from enrollment to completion by visiting us at https://motimatic.com/.
See it on your own listOne list, one goal, and a randomized holdout to show the lift. Start a pilot