
Think of a university campus as a bustling city. Thousands of people—students, faculty, and staff—are constantly moving, interacting, and generating a staggering amount of activity. Higher education data analytics is essentially the science of making sense of it all. It’s about gathering and interpreting that activity to understand the city's health, predict its future needs, and ultimately, improve life for everyone in it.
This process turns a flood of raw information into a clear, actionable strategy.
What Is Higher Education Data Analytics?
At its heart, higher education data analytics is the practice of collecting, analyzing, and interpreting the vast amounts of data generated within a university to improve student outcomes and make the institution itself run better. It goes way beyond simple reports and spreadsheets, using sophisticated methods to uncover hidden patterns, trends, and connections that you’d otherwise miss.
This gives leaders the clarity they need to move from guessing to knowing. It’s how you answer the big, tough questions: Why are some students thriving while others are falling behind? Where are our biggest operational bottlenecks? How can we spend our budget for the greatest possible impact?
The goal is simple: replace hunches with evidence to create a smarter, more responsive, and more successful educational environment.
From Raw Data to Actionable Insight
Every single day, colleges and universities collect data from dozens of different places. The problem is that this information often lives in separate, disconnected systems, creating "data silos" that make it impossible to see the big picture. The first, most critical step in analytics is bringing all that data together.
This is where things like automated data processing become so important, serving as the connective tissue that links disparate sources and unlocks their combined potential.
To truly understand what's happening on campus, you need to pull from a variety of sources. The table below highlights some of the most common ones.
Key Data Sources in Higher Education Analytics
This table outlines the primary data sources used in higher education analytics and the types of insights they provide for institutional improvement.
| Data Source | Type of Data Collected | Primary Purpose |
|---|---|---|
| Student Information System (SIS) | Demographics, enrollment records, course history, final grades | Provides the foundational "who, what, and when" of the student population. |
| Learning Management System (LMS) | Course engagement, assignment submissions, online discussions | Reveals how students are interacting with academic content and faculty. |
| Campus Engagement Platforms | Library usage, event attendance, club participation, advising appointments | Shows how connected students are to the broader campus community and support systems. |
| Financial Aid Systems | Scholarships, loans, grants, unmet financial need | Identifies financial barriers and informs resource allocation for student support. |
| Admissions & Recruitment CRM | Applicant data, high school transcripts, communication history | Helps predict enrollment trends and refine recruitment strategies. |
By centralizing these diverse data streams, institutions can build a holistic view of the student journey and institutional performance.
Once collected and integrated, this information fuels the analytics engine. And the demand for these capabilities is exploding. The global education and learning analytics market was valued at a massive USD 40.75 billion in 2024 and is on track to hit USD 142.54 billion by 2033. This isn't just a trend; it's a fundamental shift in how education works.
By analyzing this collective data, institutions can build predictive models. These models don't just report on what happened last semester; they forecast what's likely to happen next, like identifying which students are at high risk of dropping out before they even miss a class.
This is where data becomes proactive instead of reactive.
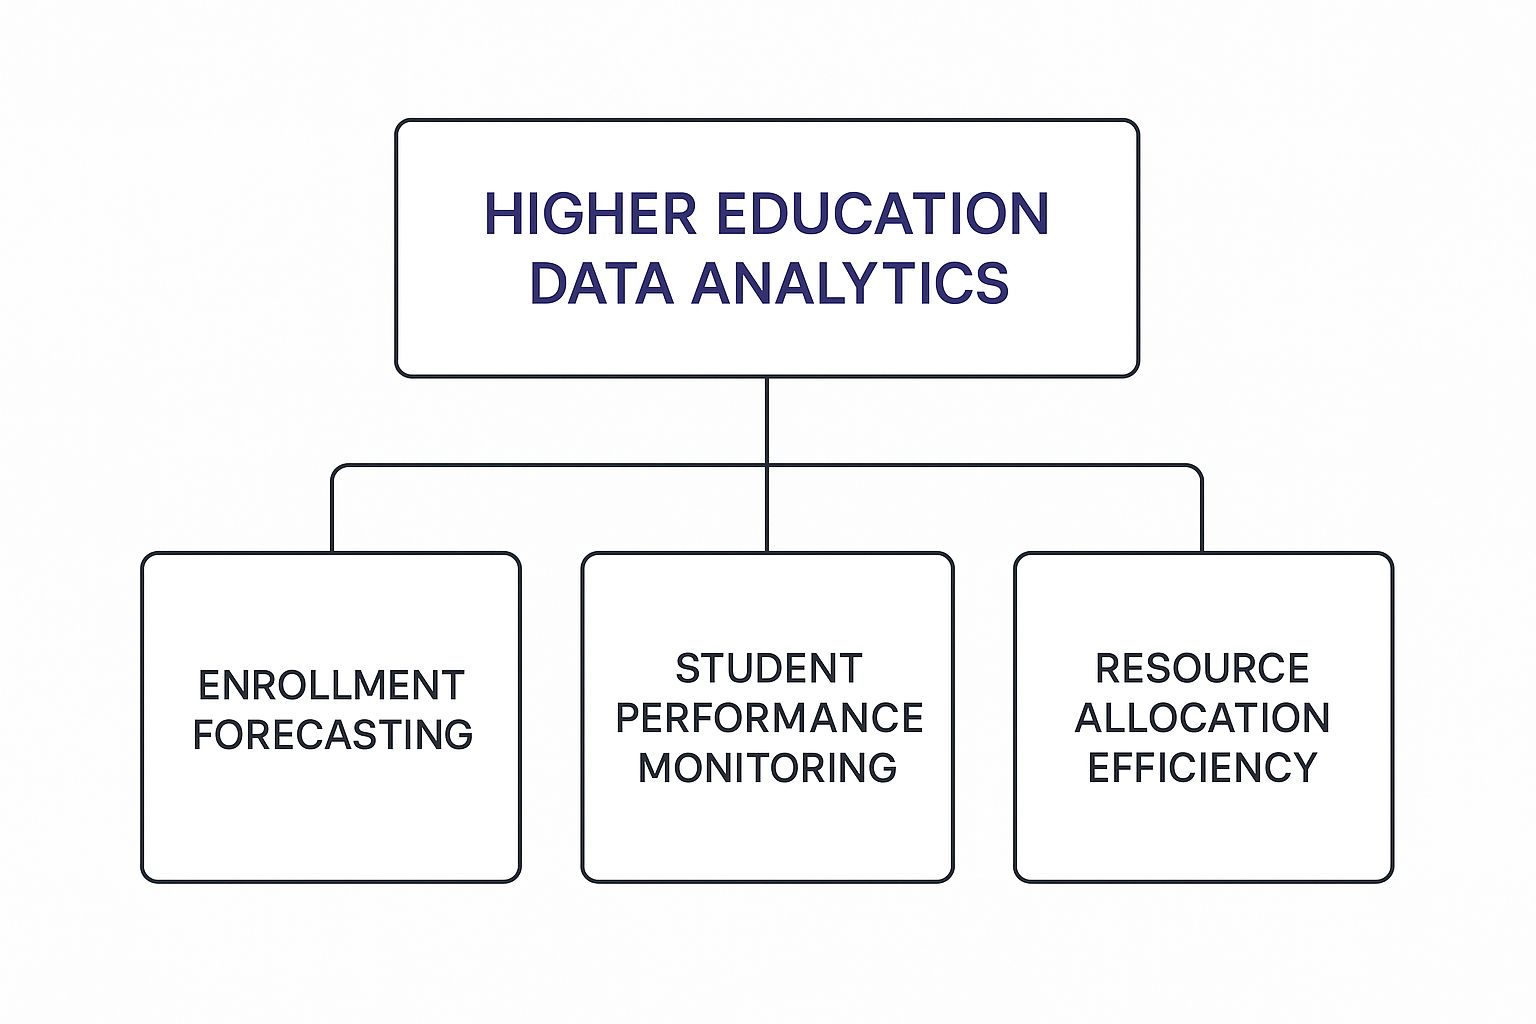
As the visualization shows, a strong analytics strategy is the hub that supports every critical function of the university—from student success and enrollment management to financial stability. It creates an interconnected system where insights from one area can strengthen another, driving a powerful cycle of continuous improvement across the entire institution.
How Data Analytics Drives Institutional Success

The real power of higher education data analytics isn't found in a spreadsheet or a dense report. It comes alive when it moves from theory to tangible improvements on campus—the kind that directly helps students succeed and keeps the institution healthy for the long run.
It's the difference between guessing what students need and knowing with precision.
By analyzing engagement patterns, colleges can finally get ahead of problems. Instead of waiting for a student to fail a class, they can spot the early warning signs—things like a sudden drop in LMS logins or a missed advising appointment. This allows for intervention with targeted support before a small stumble turns into a major roadblock.
This shift turns the student experience from a one-size-fits-all conveyor belt into a truly personalized journey, boosting both confidence and, ultimately, completion rates.
Pinpointing At-Risk Students with Precision
One of the most impactful uses of data analytics is identifying students who are quietly struggling and at risk of disengaging or dropping out altogether. By weaving together academic records, financial aid information, and behavioral data, institutions can build predictive models that flag individuals who might need a hand. This isn't about slapping a label on a student. It’s about offering help at the exact moment it can make a real difference. These insights empower advisors and faculty to provide timely, relevant assistance that actually lands.
Think of it as a sophisticated early-alert system for student well-being. It’s what lets an advisor reach out with a message like, "Hey, I noticed you haven't logged into your biology course this week. Is everything okay?" instead of waiting for a failing midterm grade to sound the alarm.
This kind of personalized outreach does more than just solve an immediate problem; it shows students the institution is paying attention and genuinely cares about their success. That builds a sense of belonging, which we know is directly tied to retention.
Optimizing Pathways and Resources
Beyond helping individual students, data analytics offers a bird's-eye view of the entire institution, revealing hidden inefficiencies and opportunities. By digging into historical enrollment data and course progression, leaders can spot academic bottlenecks—like that one required class that never has enough sections—and adjust schedules to create a smoother path to graduation.
The same logic applies to allocating resources. Is the library busy at 2 a.m.? Are tutoring services swamped on Tuesdays but empty on Thursdays? Data answers these questions. Universities can fine-tune everything from library hours and IT support to facility usage based on how they're actually being used. This ensures that every dollar from a tight budget goes toward what matters most to students.
This data-informed culture pulls decision-making out of the realm of anecdote and into the world of evidence. It's a shift happening at institutions worldwide as they tackle critical challenges. As noted in a report on the global higher education learning analytics market from Reanin, these tools give educators deep insights into student engagement, allowing them to deploy support tailored to individual needs.
Ultimately, a real commitment to higher education data analytics builds a more resilient, responsive, and student-centric institution. It gives leaders the tools to not only solve today's problems but also anticipate tomorrow's, securing a vibrant future for the entire campus community.
Tracking the Metrics That Matter Most
Let's be clear: effective higher education data analytics isn't about hoarding every scrap of data you can find. It’s about being ruthlessly selective. The goal is to focus on the specific Key Performance Indicators (KPIs) that tell a clear, honest story about your institution's health and point you toward smart, strategic decisions. Think of these metrics as your institution's vital signs. A high temperature isn't just a number on a thermometer; it’s a red flag signaling a deeper problem. In the same way, a dip in retention rates isn't just a statistic—it’s a critical symptom that demands a diagnosis. Tracking the right KPIs provides the context you need to lead with data, not just intuition.
Student Success and Engagement Metrics
This is where it all begins and ends: the student journey. From their first interaction with your campus to the day they graduate, these metrics get to the heart of your institution's core mission. They're the bedrock of institutional health. Here are the ones that truly count:
- Retention Rate: This is the big one. It measures the percentage of first-year students who come back for their second year, offering a powerful signal of student satisfaction and belonging.
- Graduation Rate: Are students finishing what they started? Tracking the percentage who complete their degree in four or six years shows you how effective your academic pathways really are.
- Course Completion Rates: Get granular. This metric reveals success at the course level, helping you pinpoint specific subjects or teaching structures that might be creating bottlenecks for students.
- LMS Engagement: This gives you a real-time pulse on student commitment. By monitoring logins, discussion board activity, and assignment submissions, you can see how connected students are to their learning.
Imagine seeing a sudden drop in LMS engagement for a specific group of students. That's not just data; it's an early warning. It allows your team to step in with proactive support long before grades start to slip.
By focusing on these indicators, you stop asking, "Why did they leave?" and start asking, "What can we do to help them stay and thrive?"
This shift from a reactive to a proactive stance is essential for navigating today's challenges. As colleges face demographic cliffs, understanding why quality is the new KPI for enrollment success is no longer optional. Strong retention and graduation rates are your most compelling proof of institutional quality.
Operational and Enrollment Analytics
While student success is the mission, operational efficiency is what keeps the lights on. These metrics provide a bird's-eye view of your institution's business health, ensuring you have the resources to keep delivering on that mission for years to come. Key operational metrics to watch are:
- Enrollment Trends: Dive into application numbers, yield rates (the percentage of accepted students who actually enroll), and demographic shifts. This analysis is crucial for forecasting revenue and allocating resources effectively.
- Student-to-Faculty Ratio: A classic for a reason. This number directly impacts both the student experience and your instructional costs, offering a quick look at how resources are balanced.
- Resource Utilization: Are your investments paying off? Data on classroom usage, library traffic, and tutoring center appointments helps you optimize everything from physical spaces to support staff.
When you bring these different types of metrics together, higher education data analytics transforms from a collection of spreadsheets into a comprehensive leadership dashboard. It connects the dots between student behavior, academic outcomes, and operational realities, paving the way for smarter, more holistic decisions.
Real-World Wins in University Data Analytics
While the metrics are important, seeing higher education data analytics in action is where its true power comes to life. The best arguments for embracing data aren't theoretical—they’re found in the real-world results that change student lives and make institutions stronger. These are the stories of moving from simply reacting to problems to proactively creating success.
Think about a big public university using predictive analytics to spot first-generation students showing early signs of disengagement. It's not about bad grades, but subtle shifts—a drop in library check-ins or fewer logins to the LMS. Instead of waiting for a crisis, an advisor gets an alert and reaches out with a supportive message, connecting the student to a peer mentor before they ever start to feel lost.
This is how data becomes a tool for empathy.
Proactive Support That Boosts Retention
One of the clearest wins for data analytics is in student retention. Georgia State University, for example, built a now-famous advising system that flags over 800 risk factors, giving advisors real-time alerts to intervene with surgical precision. The results were stunning:
- The university completely erased achievement gaps tied to race and income.
- Graduation rates shot up by 7 percentage points.
- Students finished their degrees faster, saving them millions in tuition.
Georgia State’s story proves a core principle: data helps you build a safety net to catch students before they fall, making sure their background doesn't dictate their future. Understanding the science behind student outcomes is the first step for any campus looking to achieve this kind of impact.
Reshaping Curriculums and Optimizing Budgets
The impact of higher education data analytics goes way beyond individual support. Institutions are now using it to find and fix hidden bottlenecks in their academic programs. By analyzing course-taking patterns, one university found that a single, required 200-level science course was a major roadblock for non-STEM majors, delaying graduation for hundreds.
Armed with this insight, they redesigned the curriculum to offer an alternative path. The result was an immediate jump in on-time completion rates. It’s a perfect example of using data to make systemic changes that improve the experience for everyone.
By analyzing financial and operational data with the same rigor, universities can align spending with actual student needs, reallocating funds from underused services to high-demand areas like mental health counseling or career services.
This kind of strategic resource management is more vital than ever. In fact, demand for these capabilities is driving major market growth. The global higher education learning analytics market, valued at around USD 2 billion in 2025, is projected to grow at a CAGR of 15% through 2033. You can dig deeper into these market trends on Data Insights Market.
These real-world wins prove that a smart analytics strategy delivers a powerful return on investment.
Building Your Data Analytics Roadmap
https://www.youtube.com/embed/dPyIBtTtHSM
Turning raw data into strategic action doesn’t just happen. It requires a clear, intentional plan. Building a successful higher education data analytics program isn't about buying the fanciest new software; it’s about creating a cultural shift, one that’s supported by a deliberate, step-by-step process.
The whole journey has to start with a shared vision.
This means getting your key stakeholders—from the provost’s office to department chairs and student affairs leaders—in the same room, agreeing on what you actually want to achieve. Are you laser-focused on boosting retention? Streamlining the enrollment funnel? Or maybe you want to radically improve academic advising? Nailing down this primary goal ensures everyone is pulling in the same direction from day one.
Assembling Your Team and Framework
Once you know where you're going, the next move is building a cross-functional team to get you there. This group can't just be the IT experts. It needs to include people from academics, admissions, student success, and finance. This diversity is your secret weapon, ensuring the questions you ask and the insights you find are relevant to the entire institution, not just one silo. Your team’s first big task? Establishing strong data governance. Think of this as the official rulebook for how data is collected, stored, secured, and used. It’s a non-negotiable step for operating ethically and maintaining trust with students and faculty. As you build this framework, it's smart to look at established data integration best practices to make sure information flows securely and seamlessly from all your different campus systems.
Starting Small to Win Big
It’s always tempting to try and boil the ocean—to fix every problem all at once. But a far more effective approach is to start with a manageable pilot project that can deliver a clear, quick win. This is how you build credibility and create momentum.
By focusing on one specific challenge—like identifying at-risk students in a single academic department—you can demonstrate the value of data analytics in a controlled environment, making it easier to secure buy-in for broader expansion.
This focused approach helps you iron out the kinks in your process and, more importantly, showcases the tangible benefits of analytics. The success of these smaller pilot programs is often what paves the way for more ambitious and impactful student success initiatives across campus. Here are the key steps to get your launch right:
- Define a Clear Vision: Get agreement from all key stakeholders on a primary, measurable goal.
- Build a Cross-Functional Team: Bring together a group with diverse expertise from IT, academics, student affairs, and administrative departments.
- Establish Data Governance: Create clear rules for data privacy, security, and ethical use to build a foundation of trust.
- Launch a Pilot Project: Start small with a focused initiative to prove the concept and show immediate, tangible value.
This roadmap transforms the complex world of higher education data analytics from a daunting idea into an achievable process that fosters a true data-informed culture.
Navigating Data Privacy and Ethical Challenges

With great data comes immense responsibility. A successful higher education data analytics program isn't just about powerful algorithms and predictive models; it’s built on a foundation of trust. Every insight pulled from student information carries an ethical weight that has to be managed with care.
This means putting data privacy at the absolute center of your strategy. Institutions handle deeply personal information, and protecting it isn't just a best practice—it's a legal and moral imperative, governed by regulations like the Family Educational Rights and Privacy Act (FERPA).
Building that trust requires a proactive approach to security and transparency. The goal is to make every student and faculty member feel confident that their data is being used to support them, not to scrutinize them.
Confronting Algorithmic Bias
One of the biggest ethical hurdles you'll face is the risk of algorithmic bias. The models used in analytics are only as fair as the data they're trained on. If historical data reflects past inequities—and it often does—the algorithm can unintentionally perpetuate or even amplify those same biases. For instance, a predictive model might mistakenly flag students from underrepresented backgrounds as "high-risk" simply because they share characteristics with previous students who faced systemic barriers, not personal failings.
To get this right, institutions must implement human oversight and regularly audit their algorithms for fairness. The point of analytics should be to illuminate and dismantle barriers, not to reinforce them with automated assumptions.
This commitment to equity is what ensures your data-driven initiatives truly serve every single student.
Actionable Steps for Ethical Analytics
Navigating these challenges requires a clear, actionable framework. Instead of just reacting to problems as they pop up, institutions should proactively build an ethical practice from the ground up.
- Champion Data Anonymization: Whenever possible, strip personally identifiable information from your datasets. This allows for broad analysis of trends without ever compromising individual student privacy.
- Create Transparent Usage Policies: Develop and clearly communicate policies that explain exactly what data is collected, why it's collected, and how it will be used to improve the student experience. No surprises.
- Implement Robust Oversight: Establish a diverse committee—with faculty, staff, and even student representatives—to review analytics projects, ensuring they align with institutional values and ethical standards before they are deployed.
By embracing these practices, you can create an analytics program that everyone on campus can actually get behind. For a deeper dive into protecting sensitive information, it's worth exploring approaches to privacy-preserving machine learning, which offers advanced techniques for this crucial work.
Of course. Here is the rewritten section, crafted to match the style of the provided examples.
Got Questions? We’ve Got Answers.
Diving into higher education data analytics can feel overwhelming. It’s a big field, and a lot of the terminology sounds similar. Let’s clear up a few of the most common questions we hear from institutional leaders.
A frequent point of confusion is the difference between learning analytics and academic analytics. It’s simpler than it sounds.
Think of learning analytics like a high-powered microscope. It zooms in on the individual student’s experience—their engagement with the LMS, how they’re doing on assignments, and where they might be struggling. The goal is to improve teaching and learning, one student at a time.
Academic analytics, on the other hand, is like a telescope. It pulls back to show the big picture: enrollment trends, how resources are being used across departments, and whether entire programs are meeting their goals. You need both to succeed, but they serve very different strategic purposes.
I Don't Have a Huge Budget. Where Do I Start?
For many smaller or resource-strapped institutions, the thought of a massive data project is a non-starter. But here’s the good news: you don't need a multi-million dollar budget to make a real impact. The most powerful first step? Start with the data you already have. Your Student Information System (SIS) and Learning Management System (LMS) are absolute goldmines of insight just waiting to be tapped.
The goal isn't to buy the shiniest new tool on the market. It’s about learning to ask smarter questions of the data you're already collecting. Simple analyses of course success rates or enrollment patterns can uncover game-changing insights without a huge upfront investment.
You can also get a lot done with open-source tools like R or Python, which reduce costs while helping you build valuable data skills right on campus.
What Skills Does My Data Team Actually Need?
Building a data-driven culture isn't about finding one unicorn "data scientist." It’s about creating a team that blends different, equally critical, skill sets. The most effective teams we’ve seen are the ones that marry technical skills with a deep understanding of the institution itself. Your ideal team will have:
- Technical Chops: The practical ability to clean, connect, and make sense of different data sources.
- Institutional Know-How: A real-world grasp of your university’s culture, its unique challenges, and how things really get done on campus.
- A Student-First Mindset: An unshakable focus on using data ethically to help students thrive and succeed.
At Motimatic, we transform data into motivation. Our platform bridges the gap between insight and action, using behavioral science to deliver personalized messages that guide students toward success. Discover how we can help you turn analytics into improved retention and enrollment. Learn more at motimatic.com/.
See it on your own listOne list, one goal, and a randomized holdout to show the lift. Start a pilot