What if you could see a student struggling before they failed a class? What if you had a roadmap to guide them past the common roadblocks on their academic journey?
That’s the promise of student success analytics. It’s not about surveillance or reducing people to data points. It’s about using information to build a proactive, supportive environment where every single student has a real chance to thrive.
This approach moves institutions away from just reacting to bad news—like poor end-of-semester grades—and toward actively shaping better outcomes.
Decoding the Data: What Student Success Analytics Really Means
At its heart, student success analytics is the simple idea of gathering information about students and their learning environments to figure out what works. The goal isn't just to track numbers but to understand the story behind them.
It’s about spotting patterns that signal when and how to offer the right support at the right time.
This strategy works by pulling together information from all corners of campus—the learning management system (Canvas, Blackboard), the student information system (Banner, PeopleSoft), library checkouts, even event attendance. By connecting these once-separate dots, you get a much clearer, more complete picture of the student experience. This is what allows for a shift from reactive problem-solving to proactive, evidence-based support.
The Core Components of This Approach
To really get how student success analytics works, you have to look at the pieces that make it tick. Each one plays a vital role in turning raw data into meaningful actions that can genuinely improve student persistence and completion. The table below breaks down the essential pillars of a student success analytics framework, showing what data gets used and what it helps you achieve.
| Component | Data Sources | Primary Goal |
|---|---|---|
| Data Collection | Learning Management System (LMS), Student Information System (SIS), library usage, attendance, co-curricular engagement. | Gather the raw materials needed to understand student behaviors and progress. |
| Data Integration | Data warehouses, analytics platforms, custom APIs. | Combine separate data streams into a single, unified view of each student's journey. |
| Analysis & Prediction | Statistical models, machine learning, predictive analytics tools. | Identify at-risk students, predict academic outcomes, and uncover hidden barriers to success. |
| Intervention & Action | Nudges, advisor outreach, tutoring recommendations, targeted communications. | Use insights to trigger timely, personalized support that helps students stay on track. |
At the end of the day, these components work together to create a system that’s designed to help, not just to measure.
The real power here is shifting focus from lagging indicators, like final grades, to leading indicators, like a sudden drop in online course engagement. That’s what allows you to offer help precisely when it can make the most difference.
This isn’t a niche concept anymore; it's becoming central to how modern institutions operate. The global learning analytics market was valued at around USD 14.05 billion in 2025 and is on track to hit USD 37.21 billion by 2030. You can read more about the growing learning analytics market to see just how deep this investment goes. By adopting these methods, colleges and universities aren't just boosting their metrics. They’re getting much better at fulfilling their core mission: educating and empowering students for what comes next.
The Shift to Predictive Analytics
For decades, student support in higher education felt a lot like driving while staring into the rearview mirror. Institutions would pour over end-of-semester reports, failure rates, and dropout statistics. All of it was valuable information, but it always came too late. By the time a problem was flagged, the student was already far behind, disengaged, or gone. This reactive model puts advisors and faculty in a constant state of playing catch-up. The focus is on fixing problems after they've become critical, not preventing them in the first place. But modern student success analytics flips this script entirely, enabling a monumental shift from looking backward to looking forward.
From Reaction to Prediction
The heart of this evolution is predictive analytics—a powerful approach that uses statistical algorithms and machine learning to analyze current and historical data to see what’s coming next. Instead of waiting for a failing grade on a midterm, predictive models can flag an at-risk student in the second week of the semester based on subtle shifts in their behavior. This is a game-changer for how institutions support their students. Just think about these two scenarios:
- The Old Way: An advisor sees a student failed their midterm. They reach out to set up a meeting, but by now, the student is discouraged, overwhelmed by the material they’ve missed, and maybe already mentally checked out.
- The Predictive Way: An analytics dashboard flags a student who has missed a few online class logins and hasn't touched key course readings. An automated, friendly nudge is sent to the student, and their advisor is alerted to offer tutoring resources before the first big assignment is even due.
This proactive stance changes the entire dynamic. It makes interventions timely, relevant, and far more effective.
The chart below shows how the process generally works, turning raw data into forecasts that your team can actually use.
As you can see, it starts with historical data, which is then cleaned up and used to build a predictive model. That model then generates actionable scores or insights to guide interventions.
The Power of Early Intervention
The real magic of predictive analytics isn't just spotting risk; it's creating opportunities for meaningful, early intervention. When an institution knows which students are likely to struggle, it can deploy its resources with surgical precision.
Predictive analytics allows for proactive measures, catching issues early and providing support before students fall behind. This proactive stance not only improves retention rates but also enhances the overall student experience, fostering a more supportive and responsive educational environment.
This means we can finally move beyond one-size-fits-all solutions. The data might show that one student needs academic tutoring, while another would benefit more from a conversation with financial aid or a connection to mental health services. This kind of personalized support is the foundation of effective student success programs that get to the root cause of why a student is struggling.
The market is certainly reflecting this shift. The education and learning analytics sector is projected to grow from USD 25.25 billion in 2024 to USD 29.85 billion in 2025—that’s an 18.2% jump driven by the urgent need for personalized learning and better retention.
By leaning into predictive insights, colleges and universities aren't just improving their stats. They are fundamentally changing student trajectories for the better, making sure more learners cross the finish line.
Key Metrics for Measuring Student Success
If you really want to understand a student's journey, you have to look beyond the finish line. Graduation is the goal, but the path to get there is filled with tiny, crucial moments. The best student success analytics programs are built on tracking the right key performance indicators (KPIs)—the little signposts that signal progress, engagement, and, most importantly, potential roadblocks.
Let's move from the "what" to the "how" and dig into the specific data points that create a rich, actionable picture of the student experience. These aren't just numbers on a dashboard; they’re the building blocks of proactive support. When you learn to read these signals, you can stop just measuring outcomes and start actively shaping them.
The image below shows how different metrics like GPA, retention, and engagement come together to paint that holistic picture.
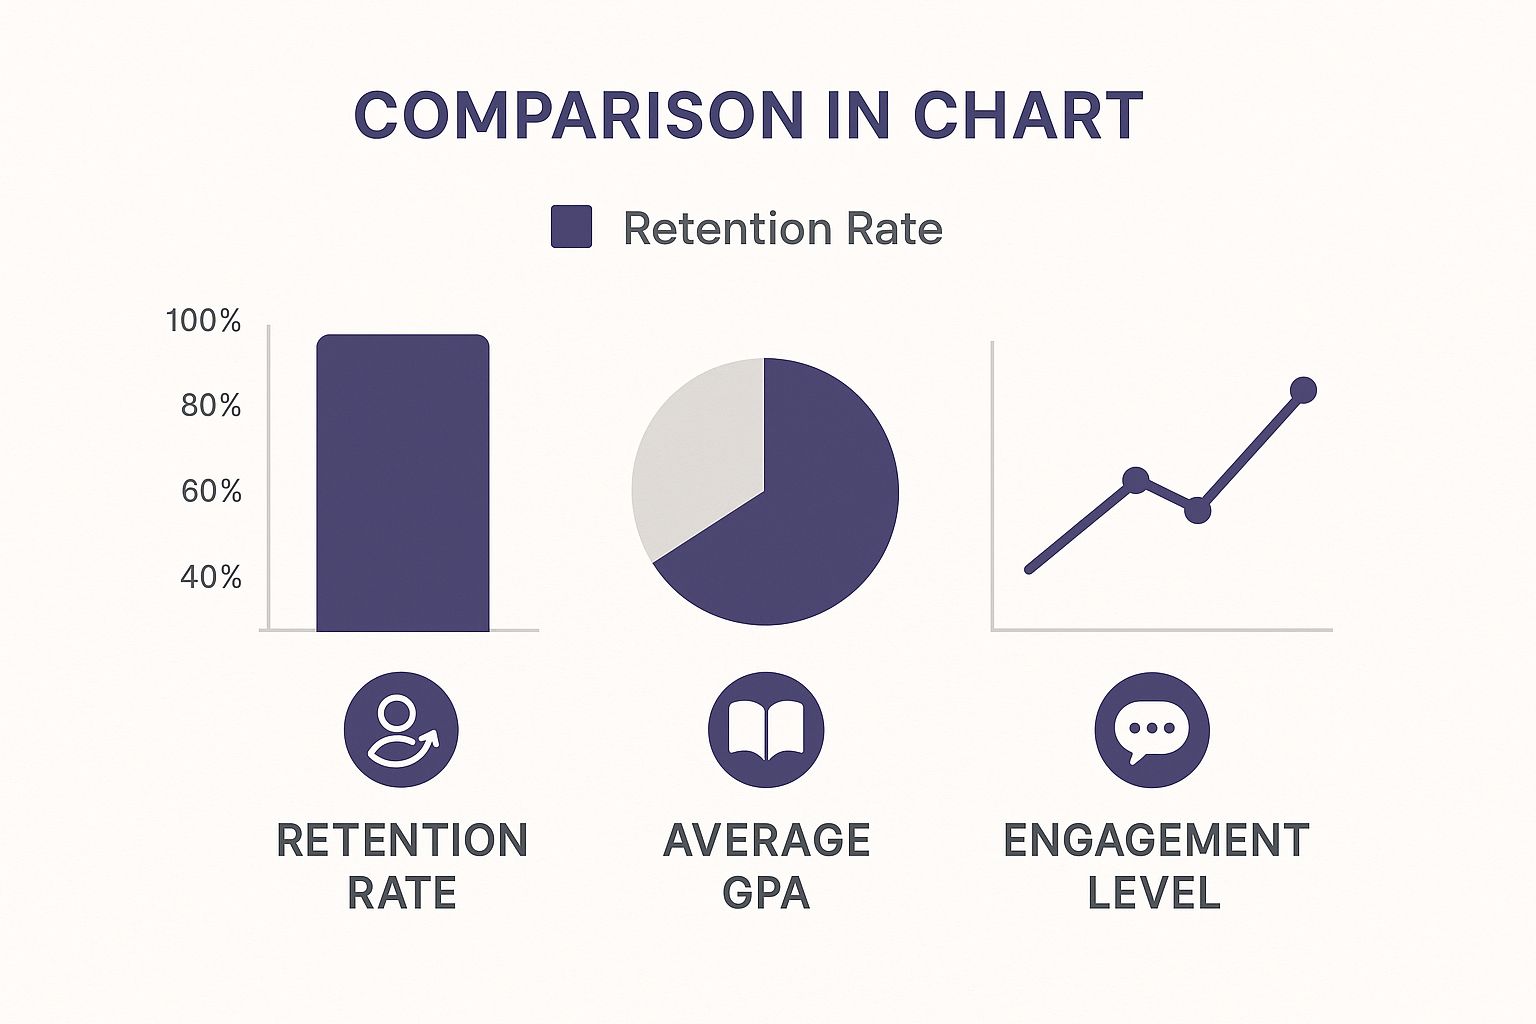
It’s a great reminder that while grades and retention are what we often focus on, deep engagement is usually the engine driving them.
Leading vs. Lagging Indicators in Student Success
Here’s where things get interesting. In analytics, it's critical to know the difference between leading and lagging indicators. Think of it like managing your health. A lagging indicator is the diagnosis you get from a doctor—it confirms you’re already sick. A leading indicator, on the other hand, is your daily step count or what you ate for lunch. It helps predict your future health.
Lagging indicators, like final grades or dropout rates, are historical facts. They tell you what already happened. Leading indicators are predictive, giving you a chance to step in before a student hits a wall.
This is the secret sauce. Focusing on leading indicators gives you the power to intervene when it actually counts, not after the fact. The table below breaks down the key differences between these two types of metrics.
| Indicator Type | Metric Example | Timing of Insight | Actionability |
|---|---|---|---|
| Leading | LMS login frequency, assignment submission pace, discussion board activity. | Real-time or near-real-time. | High: Allows for proactive intervention to prevent a negative outcome. |
| Lagging | End-of-term GPA, course withdrawal rates, annual retention rates. | After the fact. | Low: Confirms an outcome that has already occurred, limiting action to future cohorts. |
By shifting your focus to leading indicators, your institution can move from a reactive "what happened?" model to a proactive "what can we do right now?" strategy. It’s a fundamental change that can transform student outcomes.
Crucial Metrics You Should Be Tracking
With that distinction in mind, let's pinpoint the specific KPIs that belong on any robust student success dashboard. These metrics cover everything from academic progress to engagement and even how effective your own support systems are. Here are a few of the most powerful KPIs to track:
- Course Progression Velocity: This is a fancy term for a simple idea: how fast is a student moving through the courses required for their major? A slowdown is a major red flag. It could signal academic trouble, a financial hold, or just bad advice on which courses to take. It's one of the best predictors of on-time graduation.
- Digital Engagement Levels: Forget simple LMS logins. I'm talking about the deep stuff: how much time are students spending on course materials? Are they watching lecture videos to completion? How often are they interacting with digital resources? A sudden drop here is one of the clearest early warnings that a student is checking out.
- Assignment Submission Patterns: Are students consistently on time, or are they chronically late? This isn't just about deadlines; it's a direct window into a student's time management, their grasp of the material, and potential outside pressures.
- ‘Time-to-Help’ Response Rates: This one is on you. When a student is flagged as at-risk, how long does it take for an advisor or faculty member to actually reach out? This internal metric is a gut-check on the efficiency of your intervention strategy.
When you put these KPIs together, they tell a detailed story about each student. To get an even deeper understanding of what drives these behaviors, you can explore the science behind student outcomes. Remember, tracking this data isn’t about surveillance. It’s about listening. It’s about hearing what your students are telling you through their actions so you can offer smarter, more personalized support before they even have to ask.
How AI Is Supercharging Student Support
Artificial Intelligence is adding a powerful new layer to student success analytics, acting like a brilliant assistant working tirelessly behind the scenes. Think of AI less as a cold, complex algorithm and more as a tool that can spot subtle patterns in student behavior that even the most dedicated advisor might miss. It chews through massive amounts of information at incredible speed, turning messy data into clear, actionable signals.
This shift allows institutions to move beyond just identifying risk and toward delivering genuinely proactive support. AI helps answer the million-dollar questions: "Which students are quietly disengaging, and what’s the best way to reconnect with them right now?"

Augmenting Human Expertise, Not Replacing It
There's a common fear that AI is coming for academic advisors' jobs. The reality is far more collaborative and, frankly, more interesting. AI-powered systems handle the mind-numbing grunt work of data analysis, freeing up advisors from hours spent drowning in spreadsheets and reports.
Instead of hunting for clues, advisors get concise, timely alerts about students who need them. This lets them dedicate their time to what they do best: building relationships, offering empathetic guidance, and having the high-impact conversations that can truly change a student's trajectory. It’s all about enhancing human expertise with data-driven precision.
The results of this teamwork are powerful. For instance, AI-driven grade prediction tools have helped over 34,700 at-risk students avoid failure through timely intervention. What’s more, about 37% of institutions report higher student satisfaction with advising services supported by AI, and some have seen graduation rates jump by 12%. You can explore more statistics on AI’s impact in education to see just how deep its influence runs.
The true value of AI in student support is its ability to scale personalization. It empowers institutions to give every single student individualized attention—something that was previously impossible to do by hand.
This synergy between smart technology and human insight is where the magic really happens. It ensures that data-driven interventions are delivered with the warmth and understanding that only a person can provide.
Practical AI Applications in Student Success
So, what does this actually look like on campus? AI isn't some distant, futuristic concept; it's already powering practical tools that are making a real difference today. These applications are turning raw data into meaningful support systems. Here are a few real-world examples of how AI is being put to work:
- Intelligent Early-Warning Systems: These aren't your old-school risk flags. Modern systems analyze dozens of variables—from the pace of assignment submissions to digital library usage—to predict which students are falling behind with remarkable accuracy, often weeks before the problem becomes obvious.
- 24/7 Support with AI Chatbots: Students don’t just have questions during business hours. AI-powered chatbots provide instant answers on topics like financial aid deadlines, course registration, and campus resources, making sure students get help whenever they need it.
- Personalized Academic Nudges: Based on a student's unique patterns, AI can trigger automated, encouraging messages. It might send a reminder about a deadline to a student with a history of submitting late, or suggest tutoring for a specific subject after a low quiz score.
Each of these applications takes the core principles of student success analytics and gives them a massive boost with intelligent automation. In doing so, they create a more responsive and supportive educational environment where every student has a clearer path to the finish line.
Implementing Your Analytics Strategy
Moving from idea to execution is where the real work of student success analytics begins. You can have all the right data and the fanciest tools, but they’re useless without a clear plan, buy-in from across campus, and a genuine commitment to acting on what you find. This isn't about flipping a switch; it's about carefully building a new, data-informed muscle within your institution. Think of it like building a house. You don't just show up with a hammer and some wood. You need a detailed blueprint (your goals), a skilled and coordinated crew (your team), the right materials (your data), and a rock-solid foundation (leadership support). Cut corners on any of those, and you end up with a structure that's bound to collapse.
Secure Leadership Buy-In and Build Your Team
Before you even think about running a single report, your first move is to get true buy-in from the top. And I don’t just mean getting a budget approved. It's about making sure your president, provost, and other leaders genuinely understand why this matters and are ready to champion the cultural change that comes with it. Their visible support is what will get you through the inevitable roadblocks. Once leadership is on board, it's time to assemble your cross-functional team. Data silos are the sworn enemy of good analytics, so this team needs to break them down from the start. Make sure you have people from all the key corners of campus.
- Academic Affairs: They bring the crucial context on curriculum, faculty perspectives, and the realities of academic policy.
- Student Services: They're on the front lines, offering insights into advising, wellness, and the entire student experience outside the classroom.
- Information Technology (IT): You need them to manage the data plumbing, ensure everything is secure, and make different systems talk to each other.
- Institutional Research: These are your data experts, bringing the rigor needed for analysis, reporting, and validating your findings.
This mix of expertise is what ensures your insights are not only statistically sound but also grounded in the day-to-day reality of the people who need to use them.
Define Clear Goals and Start Small
One of the most common mistakes I see is trying to launch a massive, all-encompassing analytics project right out of the gate. This almost always leads to "analysis paralysis," where everyone is drowning in data and has no idea what to do first. The smarter path? Define a few specific, measurable goals and kick things off with a focused pilot project.
The goal isn't to boil the ocean. It's to prove value quickly. A successful pilot builds momentum and makes a powerful case for wider investment and adoption.
For example, instead of a vague goal like "improve retention," try something like, "reduce the DFW (D, F, Withdraw) rate in three key gateway courses by 10% in one semester." This gives your project a sharp focus, makes it manageable, and gives you a clear finish line. This targeted approach is a cornerstone of many effective student success strategies that deliver real results. Think of the pilot as your proof of concept. It's how you show everyone—from the skeptics to the stakeholders—that student success analytics is a practical tool for real change, not just another buzzword.
Avoiding Common Implementation Pitfalls
As you scale up from a successful pilot, you'll need to watch out for a few common traps that can derail even the most promising initiatives. Getting ahead of these issues will save you a world of headaches later on. Three Major Roadblocks to Watch For
- Vague Action Plans: An alert flagging an at-risk student is worthless if there isn't a clear plan for what happens next. Who makes the call? What support is offered? What's the timeline? Every single insight has to be hardwired to a specific, pre-defined workflow.
- Ignoring the Human Element: Data tells you what is happening, but it rarely tells you why. Never let your analytics replace the crucial, human conversations that are the heart of student support. The data should make advising more targeted and efficient, not obsolete.
- Poor Data Governance: If your data is messy, inaccurate, or insecure, no one will trust the system. You have to establish clear rules for data quality, privacy, and access from day one. This builds confidence and ensures you’re using information ethically and responsibly.
By thoughtfully navigating these steps—from getting the green light from leadership to planning for these common obstacles—you can build a powerful and lasting student success analytics program that becomes a core part of how your institution fulfills its mission.
Ethical Analytics and Best Practices
When you have access to this much powerful data, you also take on a profound responsibility. While student success analytics offers incredible tools to help students, it also swings open the door to some serious ethical questions. Using student information means weaving a commitment to privacy, security, and fairness into the very fabric of your strategy. The goal is always, always support—never surveillance.

It all starts with total transparency. Students have every right to know what data is being collected about them. More importantly, they deserve to know how it's being used to help them succeed. This simple act builds a foundation of trust, making it crystal clear that your analytics program is a resource for them, not a system for watching them.
Building a Strong Governance Framework
Putting these principles into action requires a robust data governance framework. This isn't some dusty document that sits on a shelf; it's a living, breathing set of rules and protocols that guides every single decision. It’s what ensures data is handled ethically from the moment it’s collected to the moment you intervene. A strong framework has to cover a few critical areas:
- Data Privacy and Security: Implement strict access controls. Think row-level and column-level security, ensuring staff can only see the data directly relevant to their roles. A principal might see building-wide trends, but an advisor should only see information for their assigned students.
- Algorithmic Fairness: Your predictive models are only as unbiased as the data you train them on. You have to regularly audit your algorithms to find and fix biases that could unfairly put certain student populations at a disadvantage.
- Clear Action Protocols: Define exactly what happens when a student is flagged. Vague plans lead to inconsistent or delayed support, completely defeating the purpose of an early warning system.
The heart of ethical analytics is treating student data with the same care and respect you'd give any other sensitive personal information. The whole point is to open doors for students, not to label them.
Best Practices for Ethical Implementation
Moving from theory to practice means committing to a few key best practices. These guidelines will help keep your student success analytics program on the right side of the ethical line, fostering a culture built on trust and genuine support. Three Pillars of Ethical Analytics
- Prioritize Transparency: Create clear, easy-to-understand communications for students that explain the program. Ditch the jargon and be upfront about the benefits and the data involved.
- Involve Diverse Stakeholders: When you're building out your models and policies, bring students, faculty, advisors, and equity officers to the table. Their diverse perspectives are absolutely essential for spotting potential biases and unintended consequences you might otherwise miss.
- Focus on Support, Not Punishment: Use the insights to connect students with resources like tutoring, financial aid, or wellness services. The data should never, ever be used for punitive actions. That’s the fastest way to erode trust and discourage students from seeking the very help they need.
Still Have Questions? Let's Talk Through Them.
Even after seeing all the good that can come from it, I get it—diving into student success analytics can feel a bit daunting. I hear the same practical questions from leaders all the time: what’s this really going to cost, what does it mean for my staff, and what are the real-world snags I’m going to hit? Let’s clear the air on some of these common concerns so you can move forward with confidence. This isn’t about getting lost in a tech maze. It’s about making smart, strategic moves that fit your school’s reality—your budget, your people, your goals. The most successful programs I've seen all started by getting straight answers to these questions first.
How Can We Get Started If We Don't Have a Huge Budget?
A tight budget isn't a stop sign. Not even close. The best first step is to look at the goldmine of data you’re already sitting on. Your Learning Management System (LMS) and Student Information System (SIS) are packed with powerful clues about course performance, how often students are logging in, and demographic trends. You can kick things off with a small, focused pilot project. Instead of trying to boil the ocean, pick one specific problem to solve, like lowering the DFW rates in a single, high-enrollment gateway course. This keeps costs down while delivering clear, measurable wins—which is, hands down, the best way to build a case for a bigger investment down the road.
Is This Going to Make Our Academic Advisors Obsolete?
This is a big one, and it's an important one. The answer is a hard no. Student success analytics isn’t built to replace the human connection that great advisors create. It’s actually designed to superpower them. Think of these tools as a hyper-competent assistant for your advising team.
Analytics platforms do the heavy lifting—sifting through mountains of data to flag at-risk students earlier and more accurately than any human could. This frees up your advisors from spreadsheet drudgery and lets them focus on what they do best: having meaningful, empathetic conversations and building relationships.
The whole point is to augment human expertise with timely data, not automate the human touch. It allows advisors to make their interventions more personal, proactive, and effective than ever before.
What’s the Single Biggest Hurdle to Making This Work?
You might be surprised. The biggest roadblock is rarely the technology itself. It’s the culture. The real work is getting faculty, staff, and administrators to actually trust the data and—this is the critical part—act on it. An analytics platform is only as good as the support it triggers.
Success hinges on building a campus-wide culture that sees data as a tool for support, not surveillance. That means being transparent, communicating clearly, and getting everyone on board with a shared mission to use these insights to help students succeed. Overcoming that cultural hurdle is the true key to unlocking everything student success analytics can do for you.
At Motimatic, we help institutions move past these hurdles. We connect data-driven insights with scalable, motivational messages that reach students with the right support at the right moment, turning analytics into real action. Learn how Motimatic can help you guide every student from enrollment to completion.
See it on your own listOne list, one goal, and a randomized holdout to show the lift. Start a pilot